How to tell if a deploy hurt conversion
Updated October 2026 · 3 min read
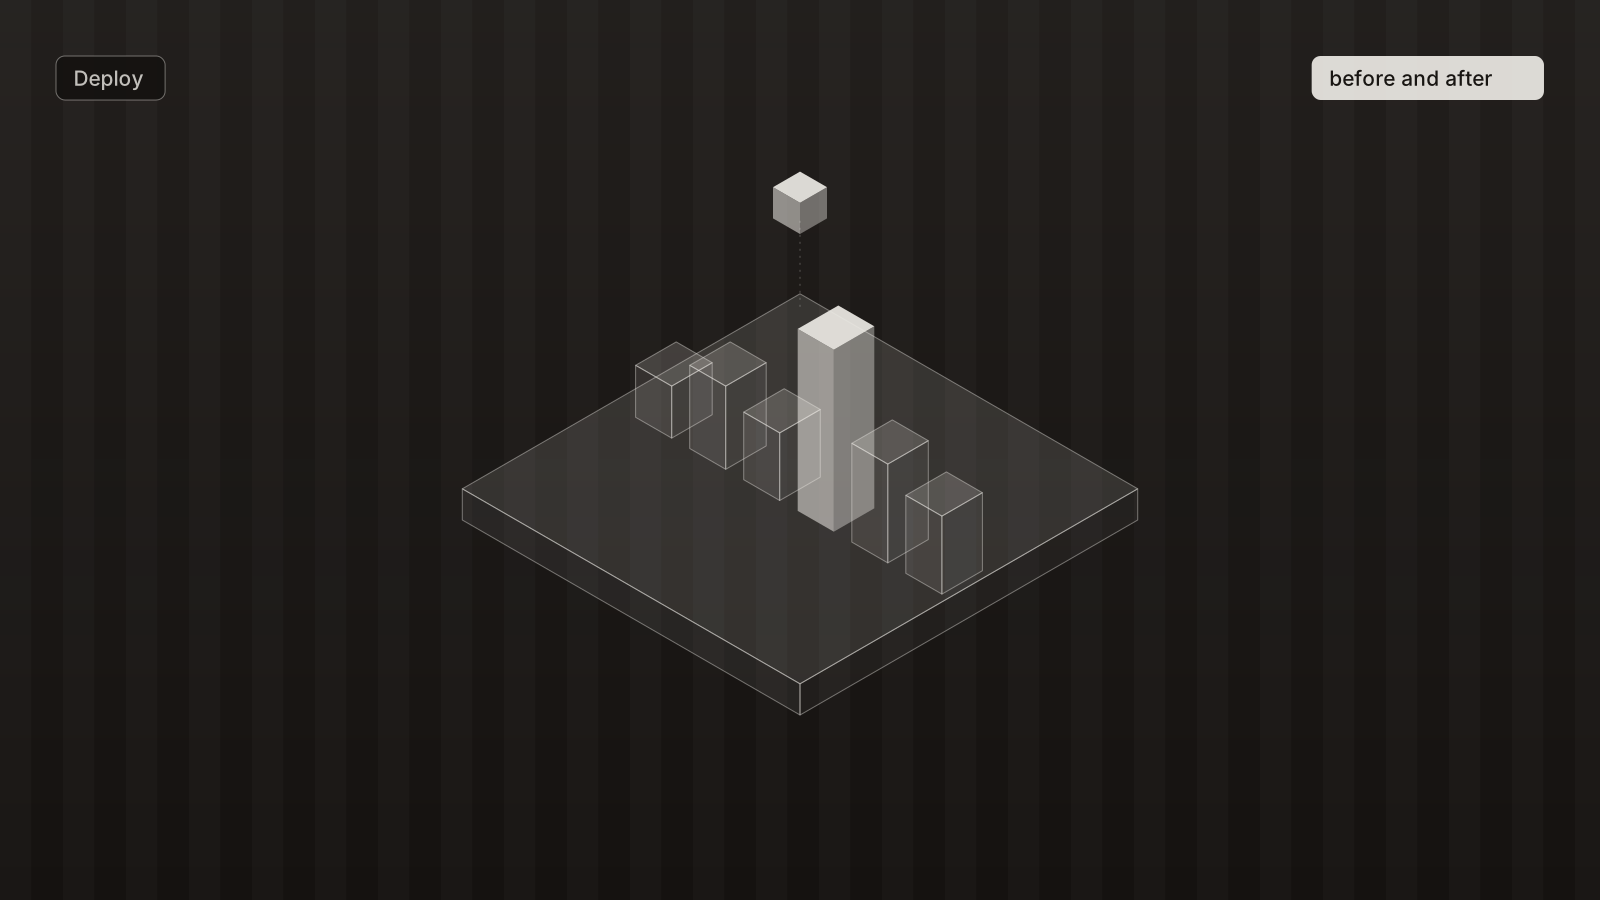
To tell whether a deploy hurt conversion, compare the 24 hours after it with the 24 hours before on three numbers: visits, the share of visits that hit a JavaScript error, and the share that converted. If the error rate rose and the conversion rate fell within hours of the deploy, and nothing else changed that day, the deploy is the likeliest cause. Clerion records each deploy from one call in your CI and draws that comparison for you; this guide covers how to do it, with or without the tool.
Why the day after is confusing
A release rarely breaks everything. It breaks one step for one kind of visitor: the delivery form on phones, the signup button in one browser, a script that loads late on slow connections. The overall numbers wobble a little, which looks like a normal day, while a slice of visitors is stuck.
So the question is not "did traffic change" but "did the share of visits that get through change, and did errors rise at the same time".
The three numbers
| Number | Why it matters |
|---|---|
| Sessions before and after | Rules out a traffic change. If visits halved, a lower count of signups is not the deploy's fault. |
| Error rate | The share of visits that hit a JavaScript error. A jump within hours of a deploy points straight at it. |
| Conversion rate | The share of visits that completed a goal. Compare the rate, not the count. |
Twenty-four hours each side is long enough to smooth out the hour of the day and short enough that the next deploy has not landed. Anything under six hours after the deploy is too little to judge.
Doing it by hand
- Note the time the deploy went live, not the time the build finished.
- In your analytics, set two ranges: the 24 hours before that time and the 24 hours after.
- Write down sessions, conversions and errors for each, and work out the two rates.
- Narrow to mobile and repeat. Most release regressions show up on phones first.
- Open the error log for the after-period and look for anything new on the page where conversion dropped.
This takes a few minutes per deploy, which is why it stops happening after the second week.
Doing it with Clerion
Add one line to the end of your deploy job:
curl -X POST https://api.getclerion.com/api/v1/deploys \
  -H "Authorization: Bearer $CLERION_KEY" \
  -H "Content-Type: application/json" \
  -d '{"websiteId":"site_...","label":"v1.8"}'
Every deploy then appears on the Errors page with sessions, error rate and conversion rate for the 24 hours before and after, with the change in red when it went the wrong way. The daily briefing reads the same rows, so a drop that starts on the day of a deploy is written up with the deploy's name. Rage clicks on the same page often show the element that stopped working.
The setup for GitHub Actions, GitLab CI and a plain script is in the deploy markers docs.
What to do when it was the deploy
Roll back first, then read. A rollback is a deploy too, so mark it, and the next day's comparison tells you whether the rate recovered. Then open the error log for the broken period and the page's rage clicks, and fix forward.
Frequently asked questions
What if two deploys went out the same day?
Their windows overlap, so the numbers share some hours. Read them together, and if you need a clean answer, space the next two by a day.
Does this work for a static site?
Yes. Any site with the script tag records errors and conversions, and the deploy call works from whatever publishes the site.
Can I mark a deploy after the fact?
Yes, within a week, by sending the time it went live with the call.