Everything it does
Analytics, errors and SEO from one line, read for you. The whole list is below, one line each, grouped the way the product is: the AI that does the reading, the numbers under it, the errors caught by the same script, and what setup, privacy and billing look like.
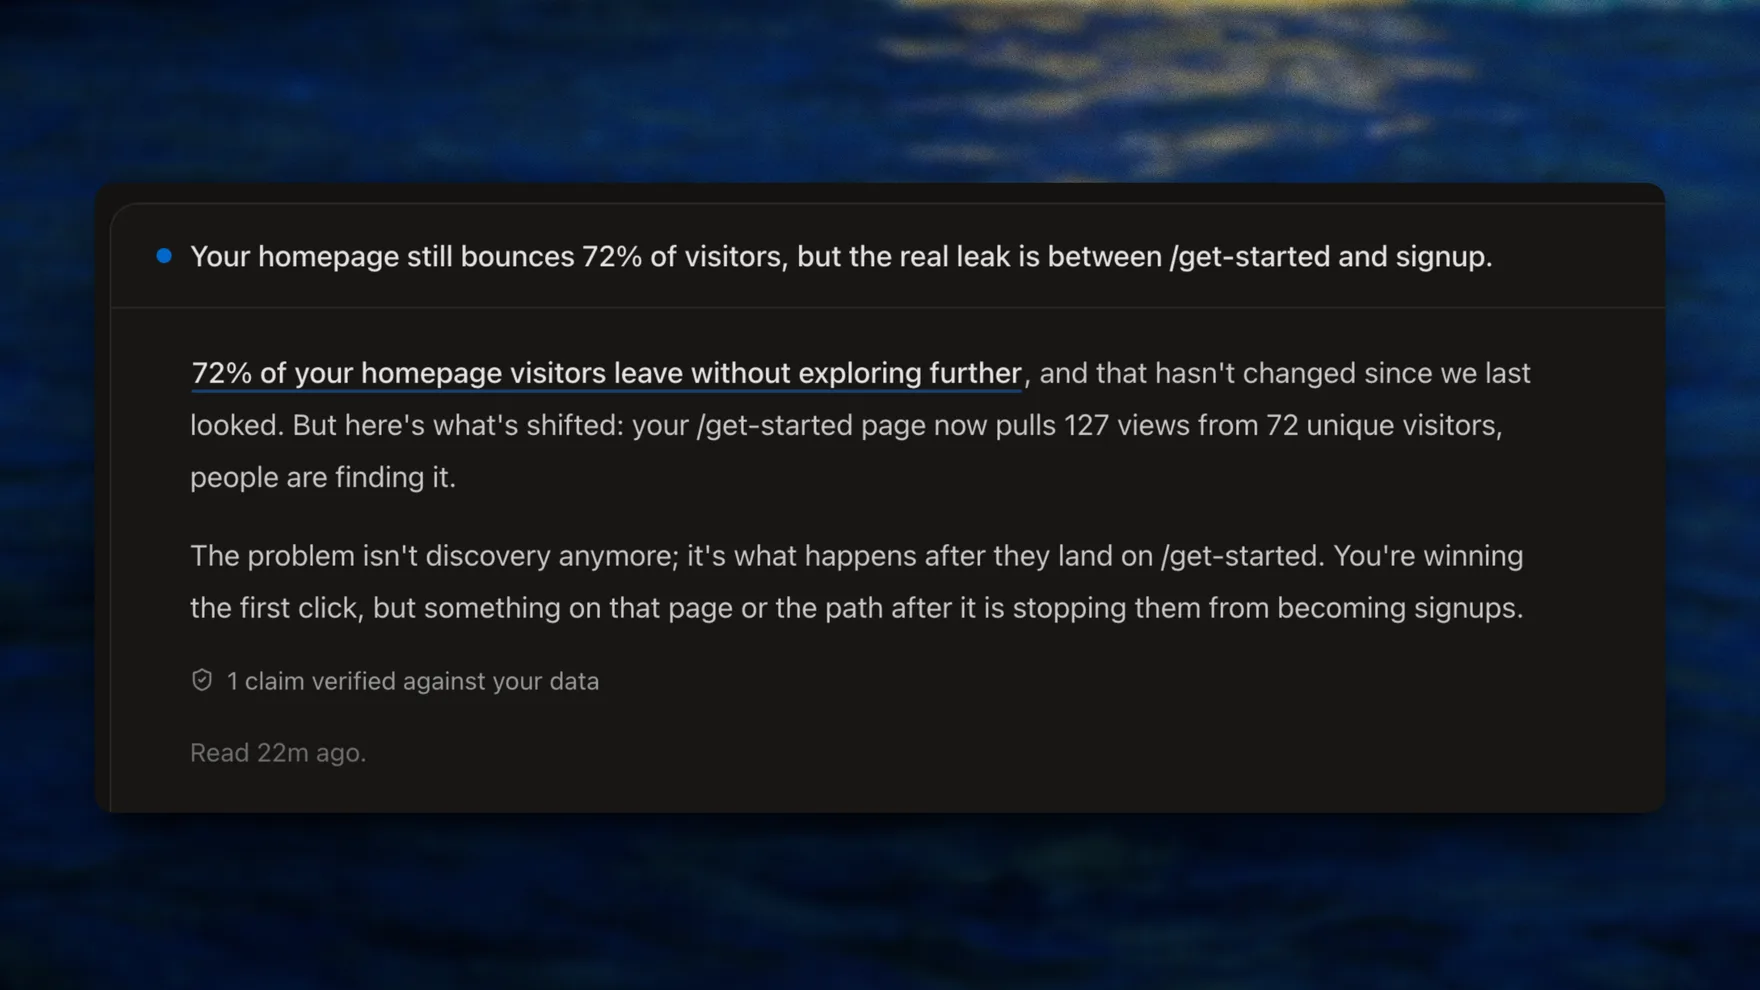
The screenshots are from Vesper, the sample store on every account, so they are real product output without being anyone’s private numbers.
AI
The part that reads the data for you.
- The briefing. Open any view and Clerion writes what changed, why, and the one fix to make first. Every sentence opens the numbers behind it.
- Your goal. Tell it what the site is for in one sentence. Every finding is ranked against that.
- No made-up numbers. The AI picks the metric. Clerion fills in the value from your data.
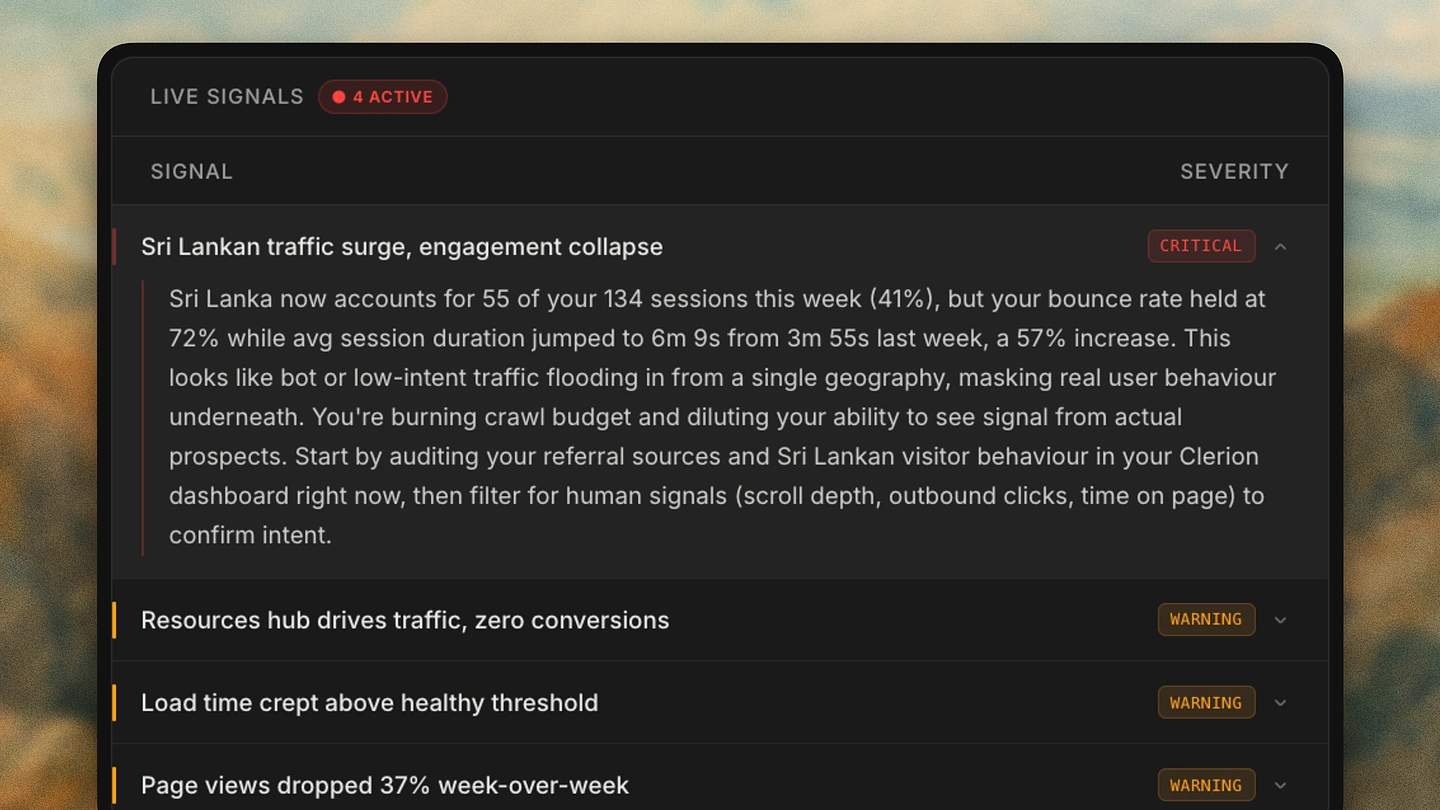
- Signals. Spikes, drop-offs, slow pages and dead ends, ranked by severity, each one click from the view behind it.
- Ask Clerion. Press ⌘K and ask in your own words. The answer comes from your own analytics.
- Audience profiles. A written profile of your visitors on each device, from your geo and engagement data.
- Error diagnosis. Every error explained, with a fix prompt you can copy to your developer.
- Site and SEO briefing. A health read for the whole site and for each page.
- Industry-aware. Recommendations adapt to your industry, from ten presets.
- MCP server. Claude, Cursor or any MCP client reads your traffic, pages, errors and speed as seven read-only tools. Hosted by Clerion, on Growth and above. Learn more.
Analytics
Every number a small site needs, and the breakdowns under them.
- Core numbers. Visitors, page views, session length and bounce rate, each against the previous period.
- Live visitors. Who is on your site right now, updated every 30 seconds.
- Momentum. Best days, growth streaks and your projected monthly pace.
- Activity heatmap. A year of traffic at a glance.
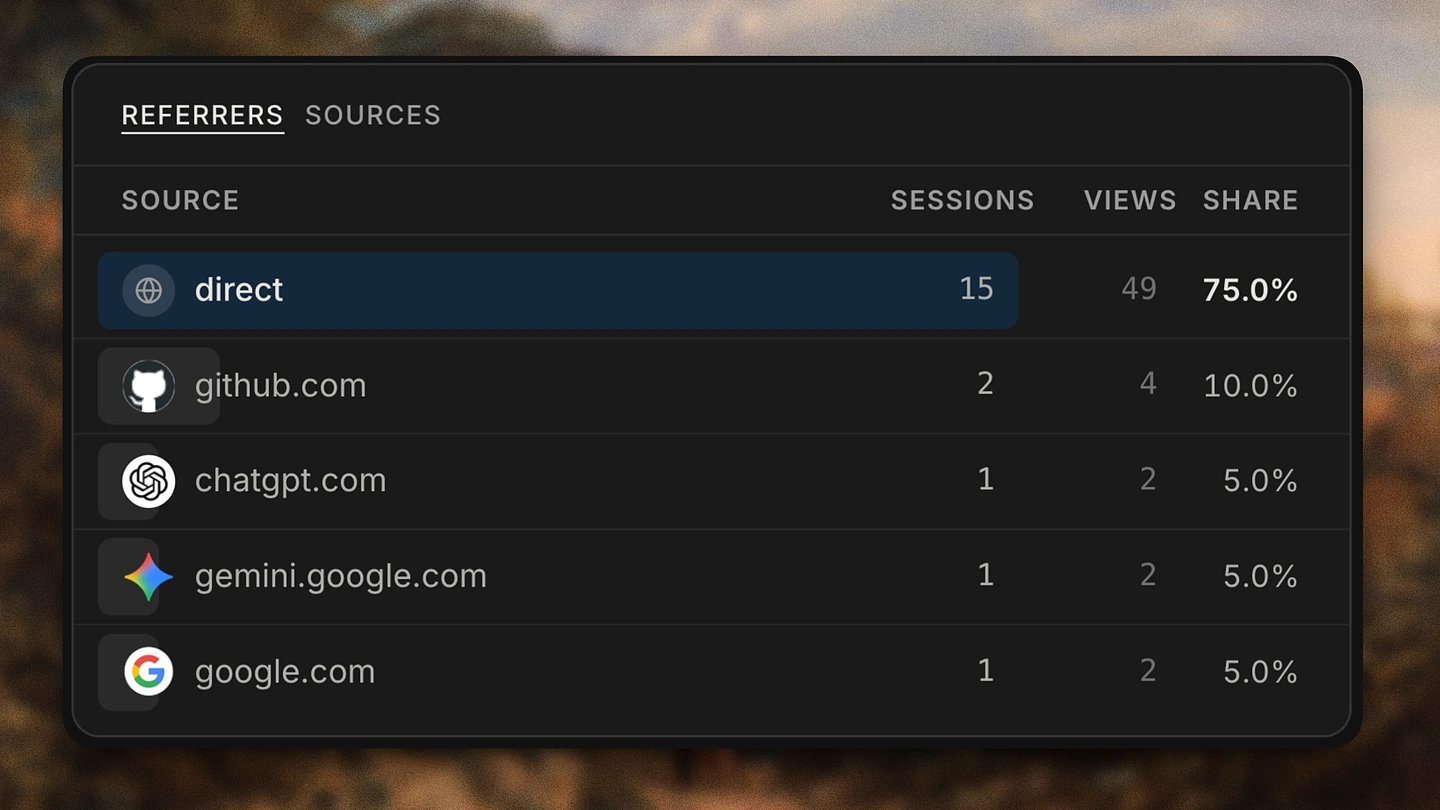
- AI assistants as a channel. ChatGPT, Perplexity, Claude, Gemini and Copilot counted as their own source.
- Audience breakdowns. Pages, referrers, countries, cities, languages, devices, browsers and screens.
- World map. Where your visitors are.
- User flow. How visitors move between your pages.
- Campaigns. Full UTM breakdowns and on-site search terms.
- Interactions. Outbound clicks, downloads, forms and top clicked elements.
- Goals and revenue. Custom events with conversion rate and revenue.
- Ecommerce funnel. Product view to cart to checkout, with the drop at each step.
- Engagement. Scroll depth, active time and clicks per session.
- Click to filter. Click any row to filter the whole dashboard. Filters live in the URL, so you can share them.
- Date ranges. Any range within your plan's memory, compared to the period before.
- Performance. Load time and Core Web Vitals, with a note on what to improve.
- Bot filtering. Bots are excluded from your numbers and your bill.
Errors
Caught by the same line that counts your visitors.
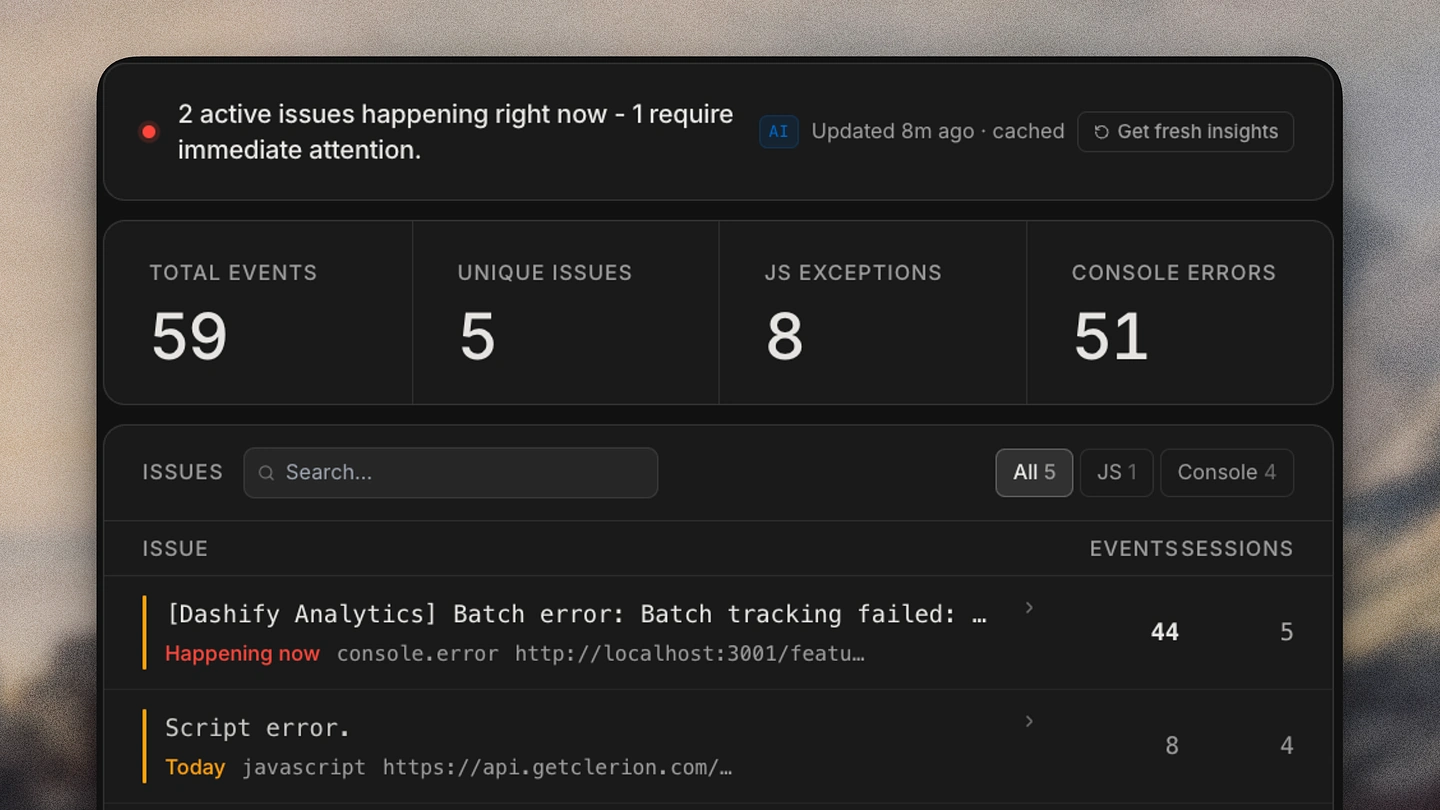
- Automatic capture. JavaScript errors are caught by the same one line. No separate tool.
- Grouped and ranked. Deduplicated, ranked by severity, with the number of sessions each one touched.
- Breadcrumbs. The visitor's last actions before the error, so you can reproduce it.
Setup
One paste, then nothing to configure.
- One script tag. Paste it once. The dashboard goes live with your first visitor.
- Tracked automatically. Pageviews, sessions, clicks, scroll, forms, downloads and Core Web Vitals. No configuration.
- Custom events. A trackEvent API, plus ready-made commerce events.
- SEO data, no crawler. The snippet reads each page's titles, meta, links and schema as visitors load it.
- Lightweight. Events are batched and sent in the background. It never slows your site.
- Consent banner, if you want one. Off by default because nothing needs consent. One toggle turns it on.
Privacy
Nothing personal is stored, so there is nothing to ask for.
- Cookie-free by default. Nothing is set or read, so there is no banner to show.
- No personal data. IP addresses are hashed and discarded. Location comes from an EU lookup service.
- Visitor signals respected. Global Privacy Control and Do Not Track are honoured.
- GDPR, CCPA and PECR. Account deletion, full export and automatic data expiry are built in.
Account
Sites, billing and the parts around the product.
- Many sites, one account. Switch between sites in a click.
- Export. Any report as CSV or JSON. Your data is yours.
- Sign in. Email and password, or Google.
- Usage. Where you stand on pageviews, sites and AI quota, and when it resets.
- Billing. Monthly or yearly, change or cancel in the app. Tracking never stops if you go over.
- Support. Send a bug or an idea from inside the app. A person replies.
- History import. Bring two years across from Google Analytics, read in your browser and never uploaded. From another tool, priority support brings it over.
- Sample site. A worked example on every account, so you can read a full dashboard before yours has data.